C++ debugging with GDB

Table of contents
Compilation flags
Use -ggdb or -g3 to include all information available to gdb.
By using -g only a limited amount of information is added to
the executable.
See the vídeo Debugging with Macros (-g3,-ggdb) for good explanation about the debug level flags.
Breakpoint
[b]reak function_name[b]reak filename:line[b]reak *memory address
Running
Use the command run to start the program execution.
$ gdb bin/gdb_test_01
$ gdb -tui bin/gdb_test_01
Create breakpoint at function my_func_01:
(gdb) break my_func_01(int, float)
Breakpoint 1 at 0x3a74
Execute the program with breakpoint
(gdb) run
Starting program: /data/home/geraldo/git/Intmain/language_cpp/bin/gdb_test_01
[Thread debugging using libthread_db enabled]
Using host libthread_db library "/lib/x86_64-linux-gnu/libthread_db.so.1".
[New Thread 0x7fffd889d700 (LWP 194516)]
[New Thread 0x7fffd809c700 (LWP 194517)]
[New Thread 0x7fffc789b700 (LWP 194518)]
[New Thread 0x7fffc709a700 (LWP 194519)]
[New Thread 0x7fffb6899700 (LWP 194520)]
[New Thread 0x7fffae098700 (LWP 194521)]
[New Thread 0x7fffa5897700 (LWP 194522)]

Thread 1 "gdb_test_01" hit Breakpoint 1, 0x0000555555557a74 in my_func_01(int, float) ()
Continue execution after breakpoint
(gdb) cont
Continuing.
s = 10 + 3.141492 = 13.141492
[Thread 0x7fffa5897700 (LWP 194522) exited]
[Thread 0x7fffae098700 (LWP 194521) exited]
[Thread 0x7fffb6899700 (LWP 194520) exited]
[Thread 0x7fffc709a700 (LWP 194519) exited]
[Thread 0x7fffc789b700 (LWP 194518) exited]
[Thread 0x7fffd809c700 (LWP 194517) exited]
[Thread 0x7fffd889d700 (LWP 194516) exited]
[Inferior 1 (process 194512) exited normally]
(gdb)
Breakpoint condition
[condition] <breakpoint #> <condition>
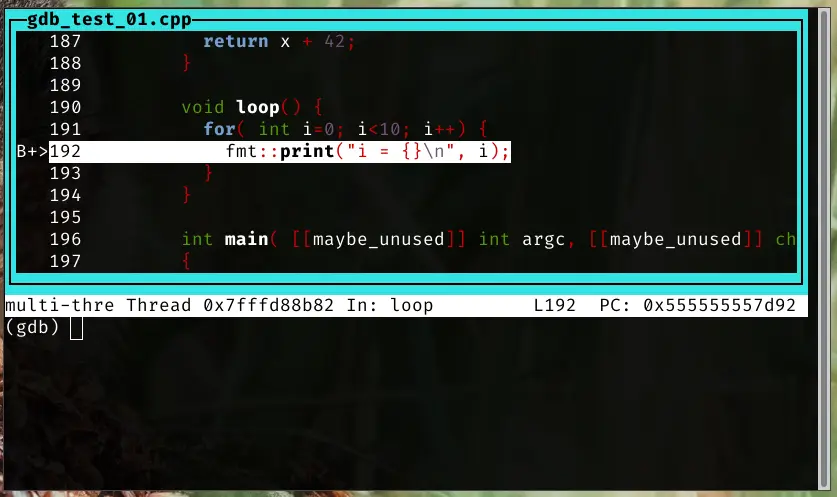
Updates the breakpoint indicated by the given number so that execution of the program stops at that point only if condition is true. condition is expressed in C syntax, and can only use variables and functions that are available in the scope of the breakpoint location.
Create the breakpoint #1 at line 112
(gdb) list
104	}
105
106	int my_func_02(int x) {
107	  return x + 42;
108	}
109
110	void loop() {
111	  for( int i=0; i<10; i++) {
112	    fmt::print("i = {}\n", i);
113	  }
(gdb) break 112
Breakpoint 1 at 0x3d92: file gdb_test_01.cpp, line 112.
Update the breakpoint #1 condition
(gdb) condition 1 i == 7
Run the program, and the breakpoint only will be actioned for i == 7
(gdb) run
Starting program:
/data/home/geraldo/git/Intmain/language_cpp/bin/gdb_test_01
[Thread debugging using libthread_db enabled]
Using host libthread_db library "/lib/x86_64-linux-gnu/libthread_db.so.1".
[New Thread 0x7fffd889c700 (LWP 490606)]
[New Thread 0x7fffd809b700 (LWP 490607)]
[New Thread 0x7fffcf89a700 (LWP 490608)]
[New Thread 0x7fffbf099700 (LWP 490609)]
[New Thread 0x7fffb6898700 (LWP 490610)]
[New Thread 0x7fffae097700 (LWP 490611)]
[New Thread 0x7fffa5896700 (LWP 490612)]
s = 10 + 3.141492 = 13.141492
i = 0
i = 1
i = 2
i = 3
i = 4
i = 5
i = 6

Thread 1 "gdb_test_01" hit Breakpoint 1, loop () at gdb_test_01.cpp:112
112	    fmt::print("i = {}\n", i);
Check backtrace
(gdb) backtrace
#0  loop() () at gdb_test_01.cpp:112
#1  0x0000555555557edc in main(int, char**) (argc=1, argv=0x7fffffffe3b8) at gdb_test_01.cpp:121
Continue the execution as well
(gdb) continue
Continuing.
i = 7
i = 8
i = 9
[Thread 0x7fffa5896700 (LWP 490612) exited]
[Thread 0x7fffae097700 (LWP 490611) exited]
[Thread 0x7fffb6898700 (LWP 490610) exited]
[Thread 0x7fffbf099700 (LWP 490609) exited]
[Thread 0x7fffcf89a700 (LWP 490608) exited]
[Thread 0x7fffd809b700 (LWP 490607) exited]
[Thread 0x7fffd889c700 (LWP 490606) exited]
[Inferior 1 (process 490602) exited normally]
(gdb)
Another option to condition is ignoring an amount of hits on an
specific breakpoint. To ignore 1000 hits on breakpont #2 you
can use:
ignore 2 1000
Watchpoint
Time travel (rr record and replay)
$ sudo apt install rr
$ sudo rr record -n ./prog args
$ sudo rr replay   # last
$ sudo rr replay /path/to/file
Multiprocess debugging
Disassembly
If you do not have access to the source code of a function and wish
to set a breakpoint on a particular instruction, call disassemble function_name (where function_name is the name of the procedure);
this command will allow you to see the memory address of each
instruction.
For the following code:
int my_func_02(int x) {
  return x + 42;
}
We can get something like:
(gdb) disassemble my_func_02(int)
Dump of assembler code for function _Z10my_func_02i:
   0x0000000000003d60 <+0>:	push   %rbp
   0x0000000000003d61 <+1>:	mov    %rsp,%rbp
   0x0000000000003d64 <+4>:	mov    %edi,-0x4(%rbp)
   0x0000000000003d67 <+7>:	mov    -0x4(%rbp),%eax
   0x0000000000003d6a <+10>:	add    $0x2a,%eax         ; 0x2a = 42
   0x0000000000003d6d <+13>:	pop    %rbp
   0x0000000000003d6e <+14>:	ret
End of assembler dump.
TUI enable
- Type
tui enableon gdb prompt -tuion command line

Displaying informations
(gdb) help p
print, inspect, p
Print value of expression EXP.
Usage: print [[OPTION]... --] [/FMT] [EXP]
FMT:
- o(octal)
- x(hex)
- d(decimal)
- u(unsigned decimal)
- t(binary)
- f(float)
- a(address)
- i(instruction)
- c(char)
- s(string)
- z(hex, zero padded on the left)
Print in binary format
(gdb) p /t 1024
$1 = 10000000000
(gdb) p /t 7
$2 = 111
Print in hex format
(gdb) p /x 1024
$1 = 0x400
(gdb) p /x 7
$2 = 0x7
Finishing
killstop debugging sessionquitstop gdb
Example code
void my_func_01( int a, float pi )
{
  auto s = fmt::format( "{} + {} = {}", a, pi, a + pi );
  fmt::print( "s = {}\n", s );
}

int my_func_02( int x )
{
  return x + 42;
}

void loop()
{
  for( int i = 0; i < 10; i++ ) {
    fmt::print( "i = {}\n", i );
  }
}

int main( [[maybe_unused]] int argc, [[maybe_unused]] char **argv )
{
  int   a  = 10;
  float pi = 3.141492;
  my_func_01( a, pi );
  loop();
  return 0;
}
Scripting
- By default during the startup, GDB executes the file
.gdbinit. - Use
--command=<filename>to specify a script
set pagination off
set logging file gdb.output
set logging on

set $var = 0 # yes, you can declare variables ...

break function1 if param1 == 32
    command 1
    print param2
    print param3->member1
    continue
end

break file.c:142 if x > 4
    command 2
    print y
    call checker_function
    continue
end

break function2 if $var++ < 3
    command 3
    print $var
    backtrace full
    continue
end

run

set logging off
quit
Possible output
s = 10 + 3.141492 = 13.141492
i = 0
i = 1
i = 2
i = 3
i = 4
i = 5
i = 6
i = 7
i = 8
i = 9